Dashboard
The dashboard is the page the web interface opens on. It shows whether the packet engine is running and receiving packets, how many connections b4 checks and how many of them a set matched, what each enabled set did in the last hour, and what needs attention. Its figures arrive over a WebSocket once a second.
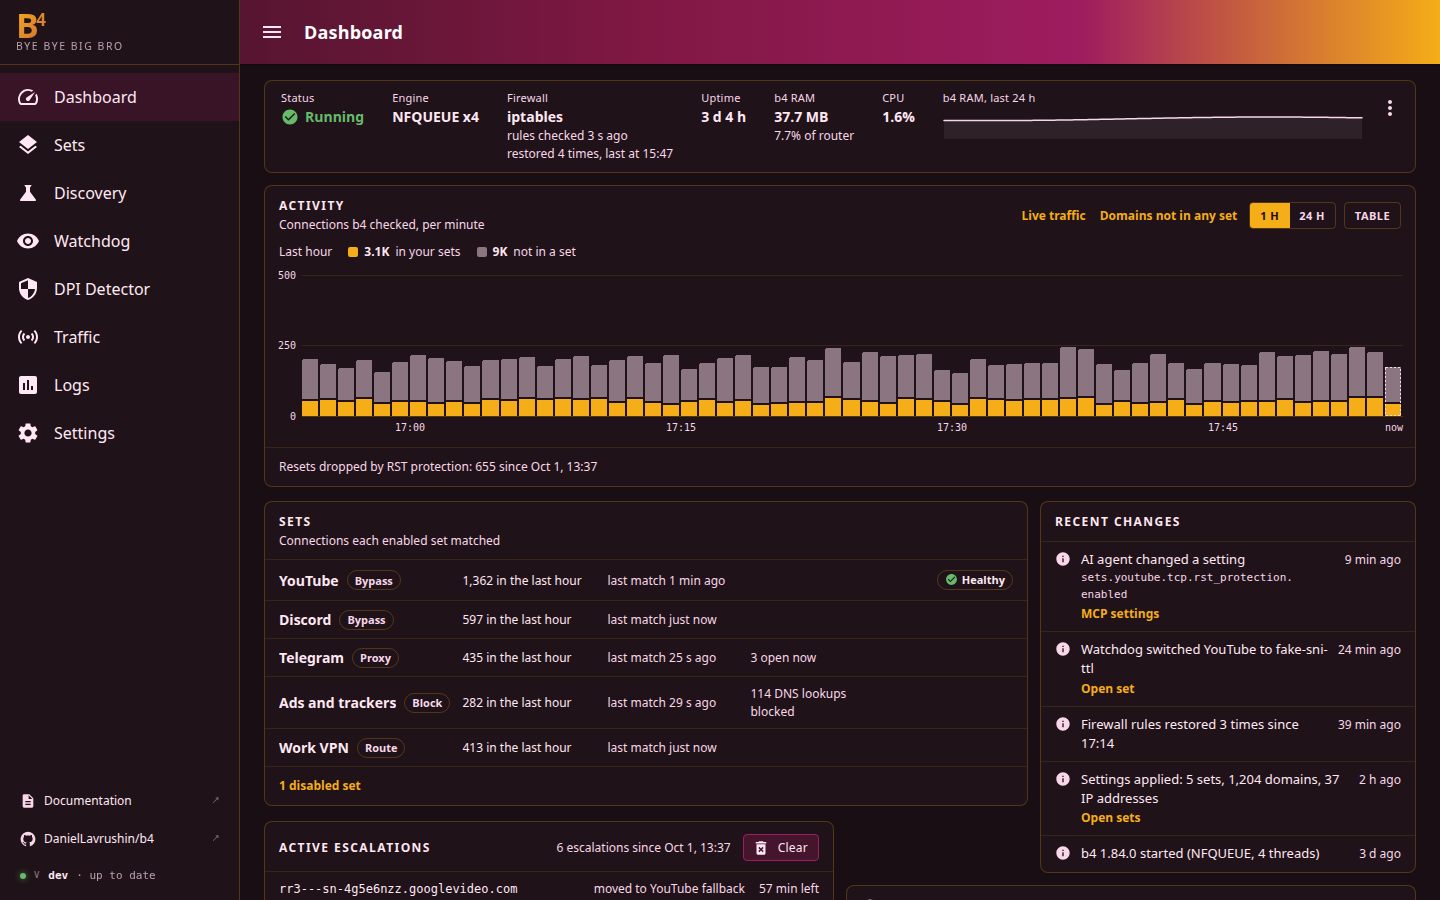
From top to bottom the page holds the status strip, a line about the live updates while they are interrupted, the packet engine card when the engine did not start, the Needs attention list when it has items, and the panels:
| Panel | Shown |
|---|---|
| Activity | Always |
| Sets | Always |
| Recent changes | Always |
| Active Escalations | While at least one host is escalated |
| Blocked | While a block set is enabled, or once something was blocked since the counters were last reset |
| Telegram | While the MTProto proxy or Telegram over WebSocket is on |
Times on the dashboard are in the browser's time zone. b4 measures every time against its own uptime and converts it with the router's clock when it sends it, so the history stays in order when the router sets its clock late, as a router without a battery-backed clock does when it syncs over NTP after boot.
Status strip

| Cell | Shows |
|---|---|
| Status | Running, Starting, Stopping, or Engine failed while the packet engine is down, see Packet engine not running |
| Engine | NFQUEUE or TUN with the number of worker threads, such as NFQUEUE x4 |
| Firewall | The firewall backend in use, such as iptables or nftables, and when the firewall monitor last checked b4's rules. not monitored: the monitor is not running, for example with Firewall monitor interval at 0 on NFQUEUE. Set up externally: Skip IPTables/NFTables setup is on, so b4 installs no rules of its own. A line such as restored 4 times, last at 19:30 counts how often since b4 started the monitor put back rules that something else had removed; some router firmware does this routinely, and it is not an error. See Settings, Core, Firewall |
| Uptime | Time since b4 started. Hovering shows the start time and, once the counters were reset, the time they count from |
| b4 RAM | b4's resident memory (RSS) and its share of the router's RAM. Hovering gives the peak of the last 24 hours, the current value and the router's total |
| CPU | b4's CPU time over the last 10 seconds, as a share of all the router's cores. Hovering shows the busiest minute of the last hour, also as a share of one core |
| b4 RAM, last 24 h | Appears once b4 has run for an hour and takes the rest of the strip: a line with the peak RSS of every ten minutes, from zero up, so a steady rise stands out and small swings stay flat. Hovering a point gives its ten minutes and peak |
The Go runtime figures (heap in use and reserved, goroutines, OS threads, open file descriptors, GC cycles) are under Process in the System Info dialog on Settings, System, Service.
The menu button at the right end of the strip holds Customize and Reset counters.
Live updates
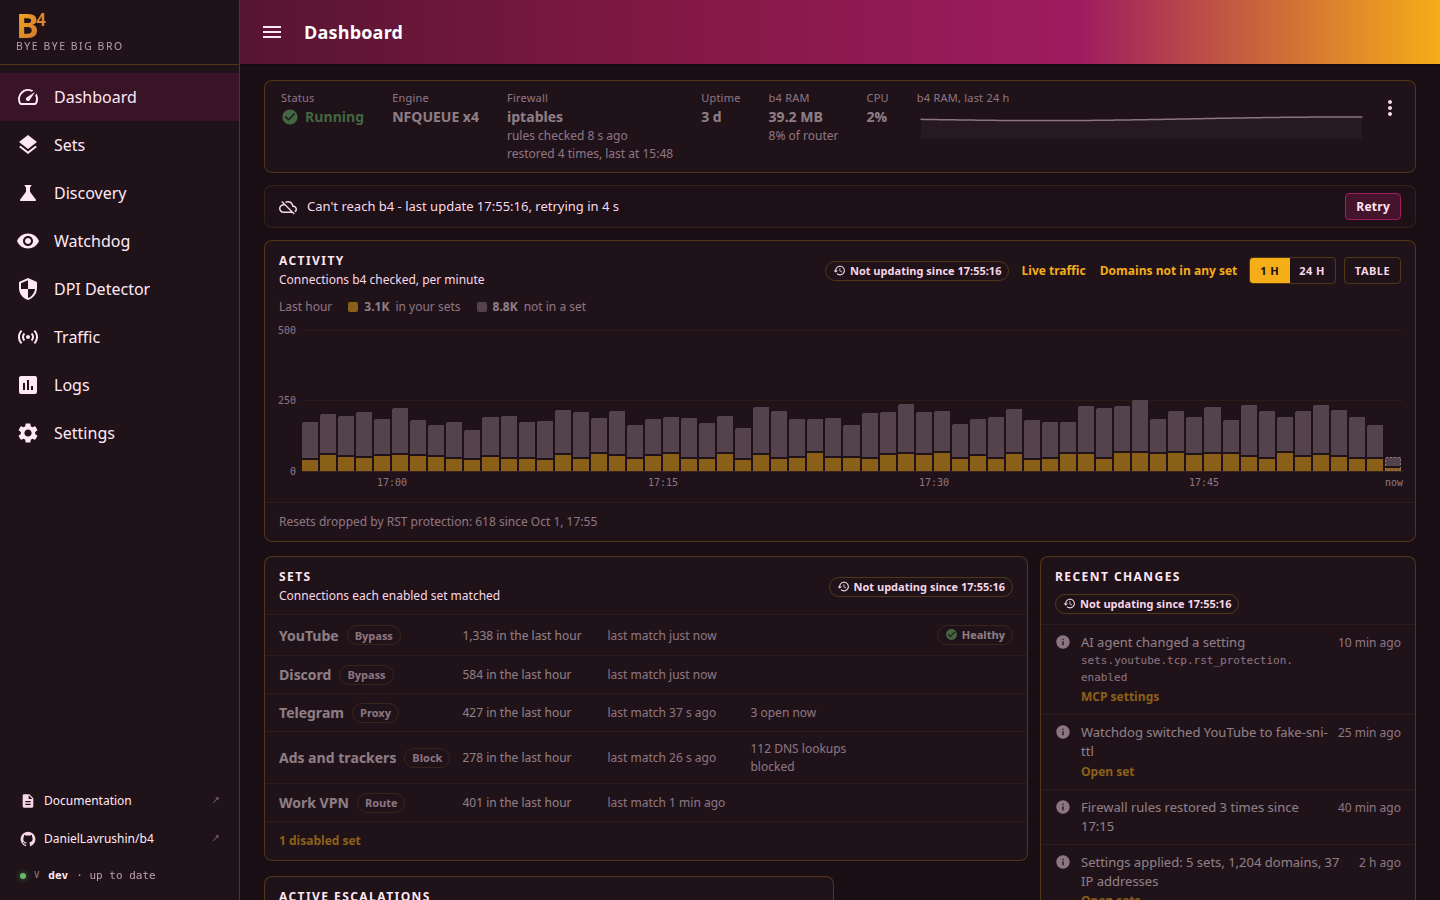
The page opens a WebSocket to /api/ws/metrics, receives a full snapshot and then one update per second. When the updates stop, a line under the strip says so, and the strip and the panels dim, each panel with a Not updating since badge that gives the time of the last update.
| Line | Meaning |
|---|---|
| Waiting for the first update from b4 | No snapshot has arrived yet. After 5 seconds the line counts the seconds and names two possible causes: b4 is restarting, or a proxy between the browser and the router blocks WebSocket connections |
| Can't reach b4 - last update 21:37:36, retrying in 4 s | The connection dropped. The browser tries again after about 1, 2, 4, 8 and 16 seconds, then every 30 seconds, and at once when the tab becomes visible or the network comes back. Retry tries immediately |
| Live updates unavailable - refreshing every 5 s | The WebSocket cannot be opened while GET /api/metrics answers, so the page fetches the snapshot every 5 seconds |
| Session expired - sign in again | The web interface asks for a login and the session is no longer valid. Sign in opens the login page |
Figures count as stale when no update arrived for 3 seconds, or for 8 seconds while the page polls.
Packet engine not running
When the packet engine did not start, a card under the status strip shows the reason and what b4 does next, and Status reads Engine failed. The state itself is described under When the engine does not start.
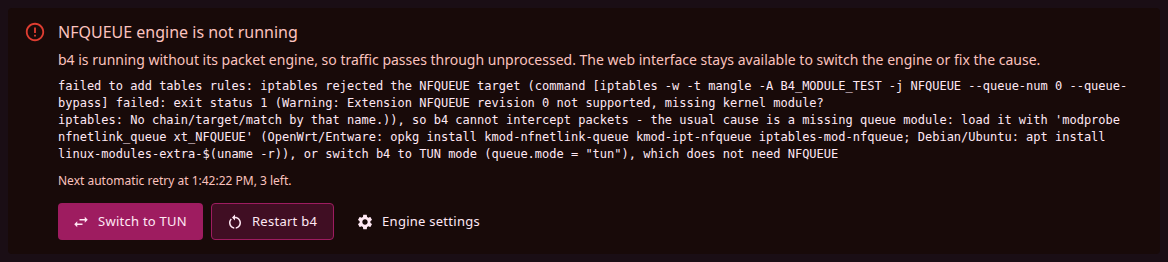
The card shows the error that stopped the engine, as written to the log, and the time of the next automatic retry with the number of retries left, or that none are left.
| Button | Action |
|---|---|
| Switch to TUN / Switch to NFQUEUE | Saves the other engine mode and opens the restart dialog |
| Restart b4 | Opens the restart dialog without changing the settings, for example after a missing kernel module was loaded |
| Engine settings | Opens Settings, Core, Packet Engine |
Needs attention
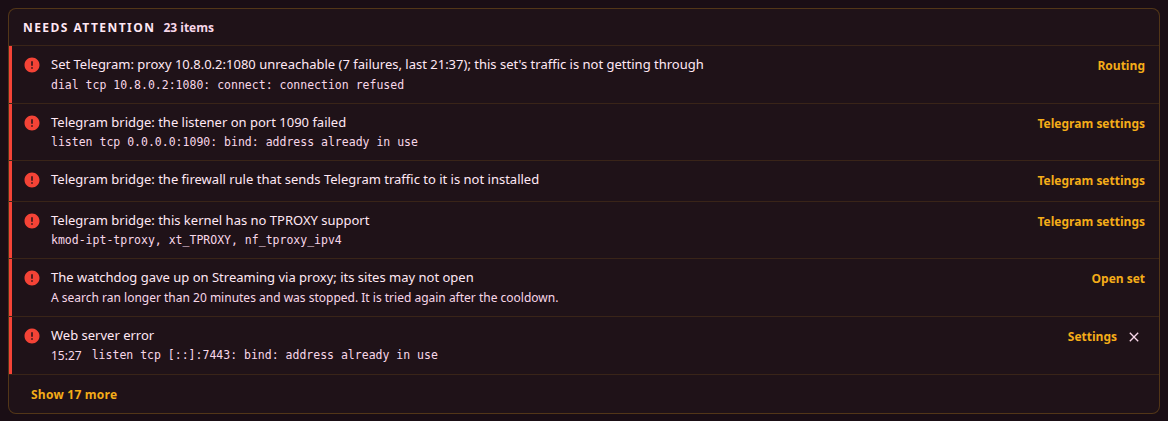
The list under the strip collects what needs action, errors before warnings, one line each with a link to the place where it is fixed. It is absent while empty, and shows six items with the rest behind Show N more.
| Item | Appears when | Link |
|---|---|---|
| Set X: proxy host:port unreachable | The upstream of a proxy set failed its recent connection attempts. An error while the set's traffic is not getting through, a warning while Fall back to direct on upstream failure sends it direct. The line gives the failures in a row and the time of the last one, the detail the error | Routing, the set's DNS & Routing tab |
| Telegram bridge: ... | Telegram over WebSocket is on, and its listener failed, its firewall rule is not installed (a warning when b4's firewall setup is off), another program's rule takes its connections, the kernel has no TPROXY support, the Telegram address list could not be downloaded (a warning), or devices sit behind a network bridge with bridge netfilter on (a warning). Each case is explained under Troubleshooting | Telegram settings |
| Watchdog checks fail for X, The watchdog is looking for a working strategy for X, The watchdog cannot check X | A watched set is Degraded or in Cooldown, waits for or runs a heal, or cannot be verified, see Statuses. The detail gives the reason | Open set, the set's Discovery tab |
| The watchdog gave up on X; its sites may not open (error) | Three heals of a watched set failed in a row | Open set |
| The watchdog is off, but N sets ask for it | Sets have Keep this set working with the watchdog on while the watchdog itself is off | Watchdog |
| No packets reached b4 in the last N min; if devices are in use, their traffic is not reaching b4 | The packet engine is running and has received no packet for 15 minutes or longer. The line gives the time of the last packet, or of b4's start when none arrived since; it reads since it started in that case | Settings, Core, Packet Engine |
| Start failures (errors) | The SOCKS5 server, the MTProto proxy or the web server did not start, the web server's TLS certificate and key were unusable and plain HTTP was served instead, or some set targets could not be loaded. The line gives the time, the detail the error | Settings: Core, SOCKS5 for the SOCKS5 server and System, Web Server for the web server; Telegram settings for the MTProto proxy; Sets for the targets |
| b4 was updated on disk; restart to run it | The file b4 was started from has changed, checked every 10 seconds | Restart opens the restart dialog |
| Overload | Within the last 10 minutes, b4 skipped the bypass for packets because 512 injections were already in flight, could not send packets it crafted, or its packet queue overflowed and the kernel dropped packets meant for it. Each comes with its count | Settings, Core, Packet Engine |
| The router's connection table is N% full; new connections may fail | nf_conntrack_count reached 90% of nf_conntrack_max, read every 10 seconds. The detail gives both numbers | - |
| b4 holds N OS threads; the Go runtime stops b4 at 4,000 | b4 holds 2,000 OS threads or more. At that point b4 also writes a goroutine dump, goroutines.txt, into the log directory when file logging is on | Logs |
| IPv6 traffic skips all sets: the router has IPv6, b4's IPv6 is off | The router has a global IPv6 address while IPv6 support is off under Settings, Core, Packet Engine. In TUN mode the line reads TUN mode does not handle IPv6; IPv6 traffic skips b4 | Settings, Core, Packet Engine |
A start failure and the IPv6 item carry a cross that hides them in this browser. A start failure stays hidden for that one occurrence, so the same failure after the next start shows again. Hiding the IPv6 item also hides the IPv6 warning under Settings, Core.
What a connection count covers
Activity, the counts on the Sets panel and the connection totals count connections, each one once. A connection is one TCP connection or one UDP flow, told apart by its addresses and ports. b4 receives only the first packets of a connection, as many as the TCP per-connection packet limit and UDP per-connection packet limit under Settings, Core allow (19 and 8 by default), so a connection is counted when it starts, and nothing on the dashboard tells how long it stayed open or how much it carried.
Counted:
- connections to the capture ports: TCP and UDP 443, the ports in the sets' port filters, and TCP 80 while a set uses Empty line before HTTP method;
- connections from the devices on the network and the ones the router opens itself, b4's own included, such as its update checks and the watchdog's checks;
- each connection or UDP session a proxy set relays through its upstream, and each session of b4's SOCKS5 server that leaves through a set's upstream.
Not counted:
- connections to other ports, apart from the ones a proxy set relays, DNS queries, and UDP to private addresses;
- Discovery's test connections;
- connections from devices that device filtering keeps out of the packet queue;
- connections the firewall drops before b4 sees them, see Blocked.
A connection belongs to the first set that matched it. One that matches a set only on a later packet, typically the TLS ClientHello after the SYN, moves from not in a set to in your sets while its minute is still open. An escalation that moves a host to another set does not count its connections again.
Activity
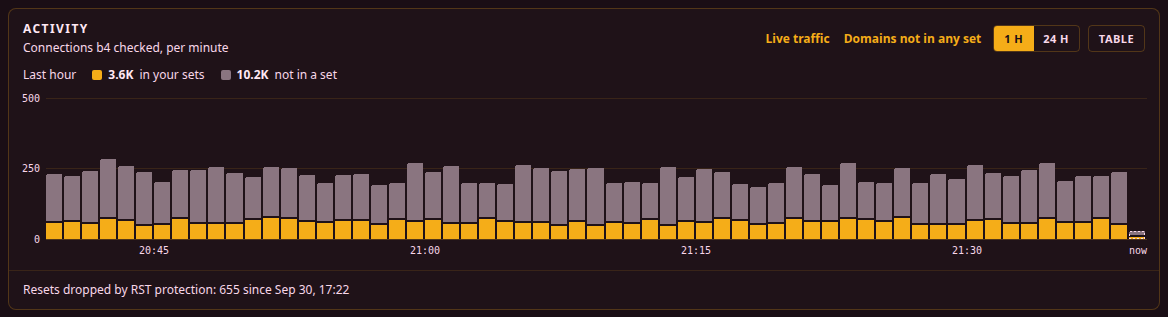
The chart shows the connections b4 checked, per minute, in two parts:
| Part | Meaning |
|---|---|
| in your sets | An enabled set matched the connection |
| not in a set | No enabled set matched it |
The line above the chart sums both parts over the window. Numbers above 999 are shortened, such as 3.6K, and hovering a sum shows it in full.
| Control | Effect |
|---|---|
| 1 h | One bar per minute over the last hour |
| 24 h | One bar per ten minutes over the last 24 hours. A bar is as high as the average per minute, so both windows share a scale; the readout gives the ten-minute total and the rate per minute |
| Table | The same buckets as rows: the time, one column per part and the total |
| Live traffic | Opens the Traffic page |
| Domains not in any set | Opens the Traffic page with Unmatched only on |
The browser remembers the window. The rightmost bar, drawn with a dashed outline, is the minute or the ten minutes in progress, and its readout says so far. Pointing at a bar, tapping it on a touch screen, or moving to it with the arrow keys once the chart has the focus shows a readout: the time range, each part and the total. Home and End go to the first and last bar, Escape closes the readout. On a narrow screen two buckets share one bar, and the readout says so.
When b4 started inside the window, a line marks b4 started with the time, and nothing is drawn before it: b4 was not running then, so those minutes are absent rather than zero. A window without a connection reads No connections checked in the last hour or in the last 24 hours.
When RST protection dropped something since the counters were last reset, a line under the chart counts the resets RST Injection Protection dropped.
The history is held in b4's memory, 60 minutes and 24 hours of it, so a restart of b4 starts it over. Reset counters leaves it alone.
Sets
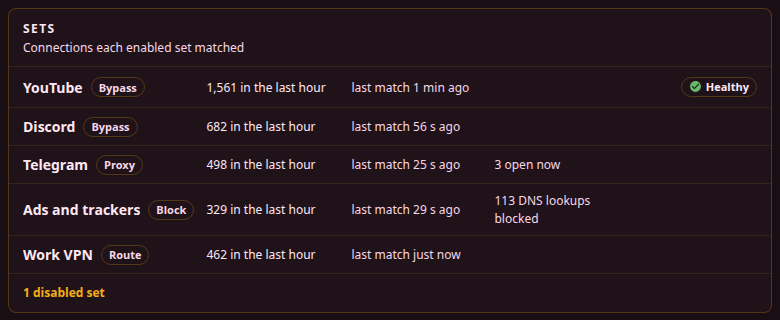
One row per enabled set, in the order of the set list.
| Part | Shows |
|---|---|
| Name | The set's name, a link to its editor |
| Kind | Bypass: the set has routing off and applies its DPI bypass strategies. Route: it routes its traffic through an interface. Proxy: it relays its traffic through an upstream SOCKS5 proxy or in the Telegram over WebSocket mode. Block: it blocks what it targets. See Routing and Blocking |
| N in the last hour | The connections the set matched in the last 60 minutes, the current one included, each counted once, see What a connection count covers. For a watched set this includes the watchdog's own checks, which go through the live engine like any other connection |
| last match | When the set last matched a new connection, or no match since b4 started |
| N open now | Proxy sets: the connections open through the set's listener right now |
| upstream down | Proxy sets whose upstream failed its recent connection attempts. Hovering names the upstream, the failures in a row, the time of the last one and the error, and says whether the set's traffic is not getting through or goes direct |
| N DNS lookups blocked | Block sets: the DNS lookups the set blocked since the counters were last reset |
| Watchdog chip | Watched sets: the set's state in the watchdog |
The chip sums up the watchdog's status for the set, and hovering gives the full status with its reason:
| Chip | Watchdog status |
|---|---|
| Healthy | Healthy |
| Failing | Degraded or Cooldown |
| Healing | Search queued or Searching |
| Gave up | Gave up |
| Can't check | Cannot verify |
| Not checked yet | Queued, or no check yet |
| Watchdog off | The set asks for the watchdog, but the watchdog is off |
The chip opens the set's Discovery tab, or the Watchdog page while the watchdog is off.
Under the rows, N disabled sets opens the set list. While no set is watched and at least one bypass set is enabled, a line reads b4 does not check whether these sites open - set up the watchdog, with a link to the Watchdog page. Without sets the panel reads No sets yet: b4 changes nothing until a set targets sites, with links to create a set and to Discovery, and with every set disabled, No set is enabled: b4 changes nothing until a set is enabled.
Recent changes
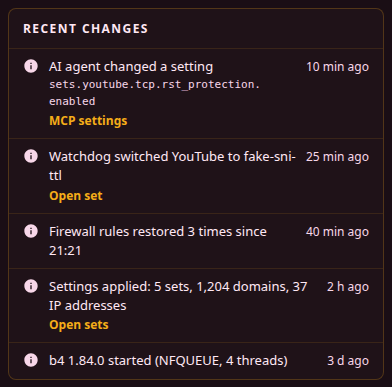
What happened to b4 since it started, newest first: eight entries, then Show N more. Each entry gives the time as an age, with the exact time on hover, and a link where one fits. Warnings and errors carry their level.
| Entry | Written when | Link |
|---|---|---|
| b4 1.84.1 started (NFQUEUE, 4 threads) | b4 finished starting | - |
| NFQUEUE engine did not start (error) | The packet engine failed to start; the detail gives the error | View logs |
| Settings applied: N sets, N domains, N IP addresses | A configuration save was applied | Open sets |
| Some set targets could not be loaded, SOCKS5 server did not start, MTProto server did not start, Web server error, Web server TLS is not usable, serving plain HTTP instead (errors) | That part failed at start, or the web server failed later; the detail gives the error | View logs |
| Firewall rules restored | The firewall monitor put b4's rules back. Restores within the same clock hour share one entry: Firewall rules restored N times since HH:MM | - |
| Watchdog switched X to Y | A watchdog heal wrote a new strategy into a set | Open set |
| Watchdog gave up on X (warning) | The watchdog gave up on a set; the detail gives the reason | Open set, the set's Discovery tab |
| AI agent changed a setting | An AI client changed a setting or reverted a change through MCP. The detail gives the setting's path, never its value | MCP settings |
The list is held in b4's memory, at most 50 entries, so a restart of b4 starts it over. Reset counters leaves it alone.
Active Escalations
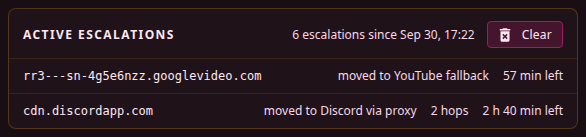
The panel is on the page while at least one host is escalated, that is, moved to a backup set because its set kept failing for it. Each row names the host, the set it moved to, how many escalations in a row brought it there when that is more than one, and the time left before it goes back to its original set; hovering the time gives the clock time. The header counts the escalations since the counters were last reset.
Clear sends every escalated host back to its original set at once, after a confirmation that gives their number. b4 also forgets the RST and DNS failures it counted towards escalation, for every host, so a host escalates again only after new failures. Reset counters does neither.
Blocked
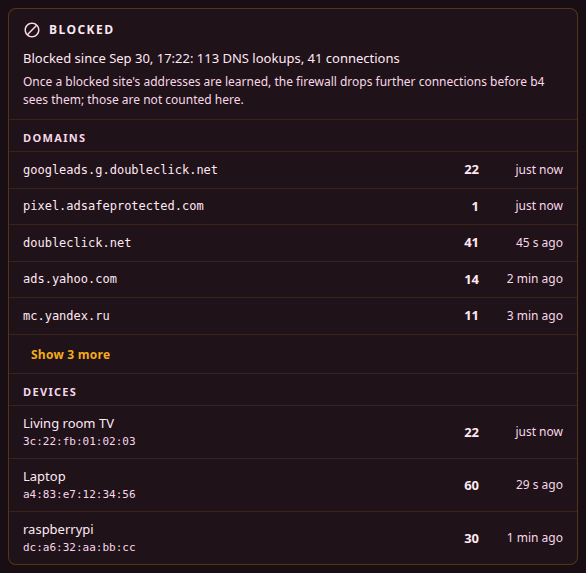
The panel is on the page while a block set is enabled, or once something was blocked since the counters were last reset. The first line counts what b4 blocked in that time: DNS lookups it answered or dropped for a block set, and connections it blocked, each connection once.
Domains lists the blocked names, or the address of a connection without a name, and Devices the devices whose lookups and connections were blocked, newest first, each with a count and the time of the last block. The lists keep the 100 domains and the 50 devices seen most recently. A device opens the Traffic page filtered to that device.
The counts cover what b4 blocked itself. Once the addresses of a blocked site are known to the set, the firewall drops further connections to them before b4 sees them, as it does for the set's address targets, and those drops are not counted.
Telegram

The panel is on the page while the MTProto proxy or Telegram over WebSocket is on. Telegram settings opens Settings, Telegram.
For the MTProto proxy the first line gives its port, the client networks using it right now, the open connections and the data sent and received. A row per secret repeats these figures for that secret, and hovering its network count lists the addresses. Devices that share one internet connection count as one network. The data of a session is added when the session ends, so a long session shows its traffic only after it closes. The figures are held in memory since the proxy started, and Reset counters leaves them alone.
For Telegram over WebSocket one line gives the sessions relayed, the time of the last one and the failed connections to Telegram's data centres, followed by not working while the bridge's rule or its listener is missing, another program's rule takes its connections, or the kernel has no TPROXY support. The page fetches this status once a minute. The same figures are on the bridge's card under Settings, Telegram, explained under Troubleshooting.
Customize
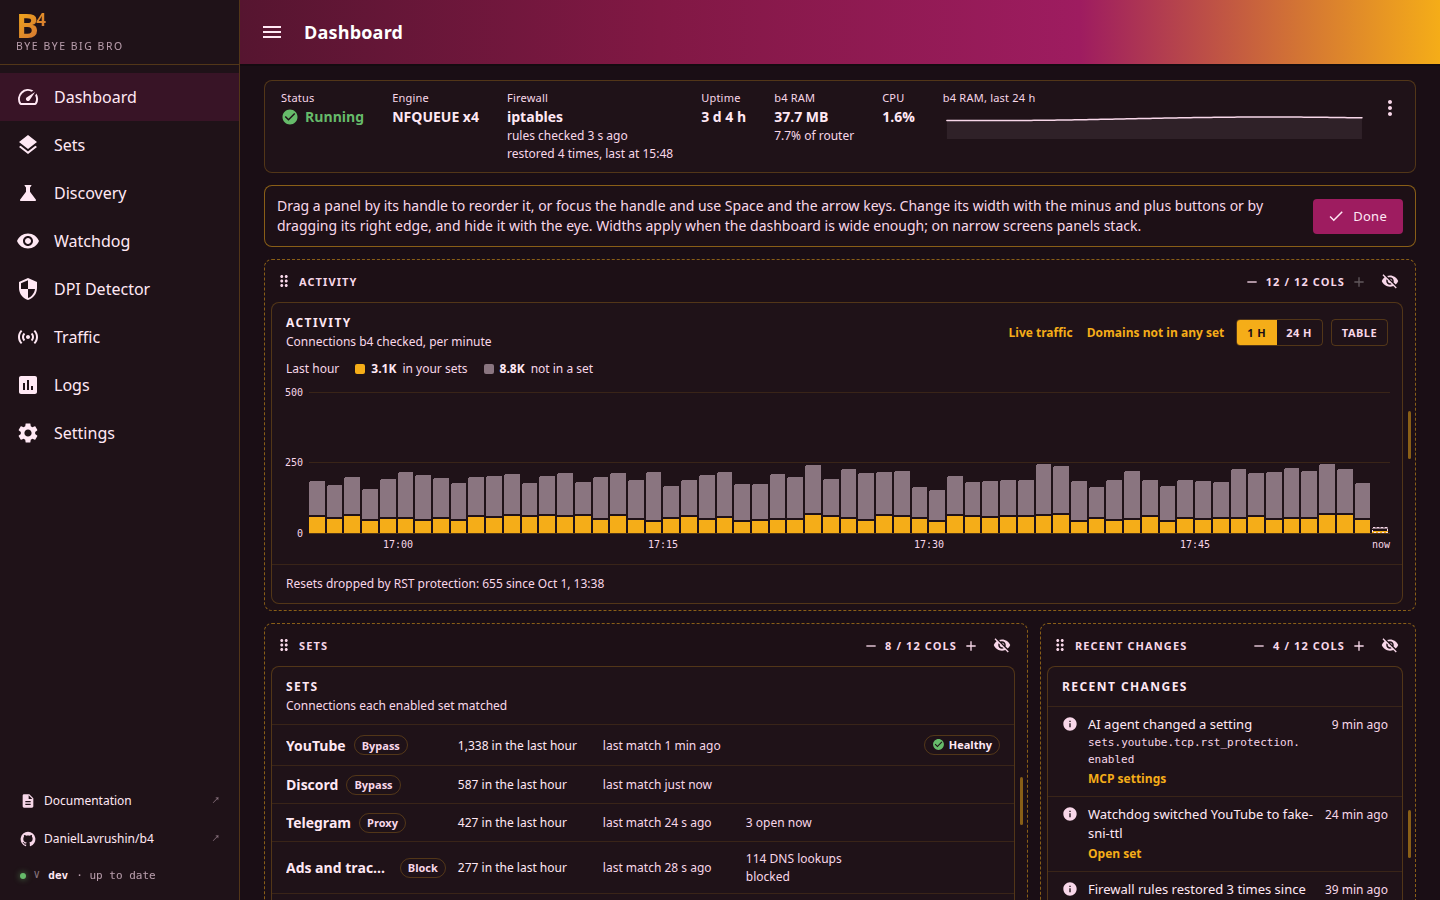
Customize in the strip's menu switches the panels into edit mode, and Done ends it.
| Action | How |
|---|---|
| Move a panel | Drag it by the handle in its header, or focus the handle, press Space or Enter, move it with the arrow keys and press Space or Enter again. Escape cancels |
| Change its width | The minus and plus buttons change it by one column of twelve, between 3 and 12. Dragging its right edge does the same |
| Hide it | The eye button. Hidden panels are listed in the edit bar, and clicking one brings it back; one that has nothing to show at the moment is marked no data |
| Start over | Reset layout, shown once the layout differs from the default |
By default Activity spans the full width, Sets (8 columns) sits beside Recent changes (4), Active Escalations and Blocked take 6 columns each, and Telegram spans the full width. Widths apply while the panel area is at least 960 pixels wide; narrower, the panels stack in their order. A panel that has nothing to show leaves no gap.
The layout is saved in b4's configuration, under ui.dashboard, so every browser that opens the web interface gets the same one. The browser keeps a copy, which it uses while b4 cannot be reached.
Reset counters
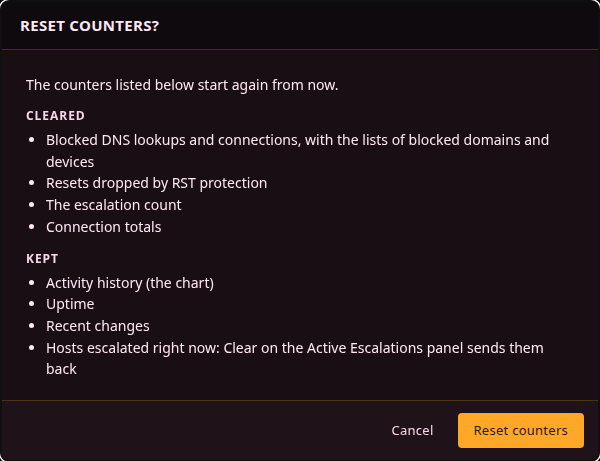
Reset counters in the strip's menu starts the counters below again from that moment, after a confirmation that lists what it clears and what it keeps. The Uptime tooltip then shows the time they count from.
Cleared:
- blocked DNS lookups and connections, the lists of blocked domains and devices, and the N DNS lookups blocked of block sets;
- the resets dropped by RST protection;
- the escalation count in the Active Escalations header;
- the connection totals, the ones
b4_status,b4_metricsand/api/metrics/summaryreport.
Kept:
- the Activity history, and with it the counts on the Sets panel;
- the uptime;
- Recent changes;
- the hosts escalated right now, which Clear on the Active Escalations panel sends back;
- the Telegram figures.
Up to 1.84.0 the button was Reset Stats, and it also sent every escalated host back to its original set.
GET /api/metrics returns the snapshot the page receives first over /api/ws/metrics, and GET /api/metrics/summary a short summary of it. POST /api/metrics/reset and POST /api/escalations/clear are Reset counters and Clear. Over MCP, b4_status and b4_metrics report the same counters.